
Every number has a source.
Platform numbers flatter everyone, so each one below says where it comes from and what it doesn't prove. The screenshots sit next to the tables, account details blurred. On a call I'll open the live accounts.
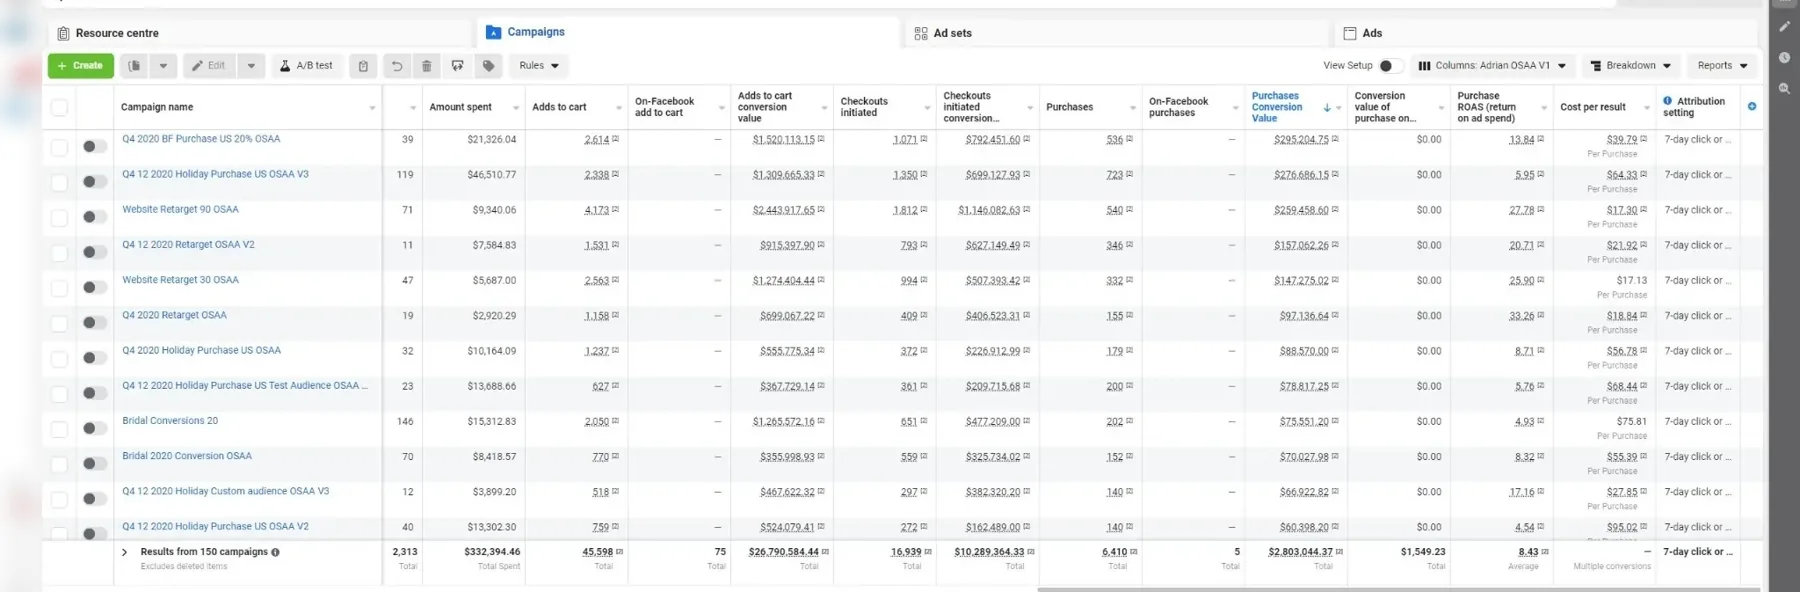
Meta-reported sales for one US pearl jeweler, 2020 to Oct 19 2026, at 5.97 ROAS.
Same client, seven years.Source: client P&L sheet and Meta Ads Manager, account totals.
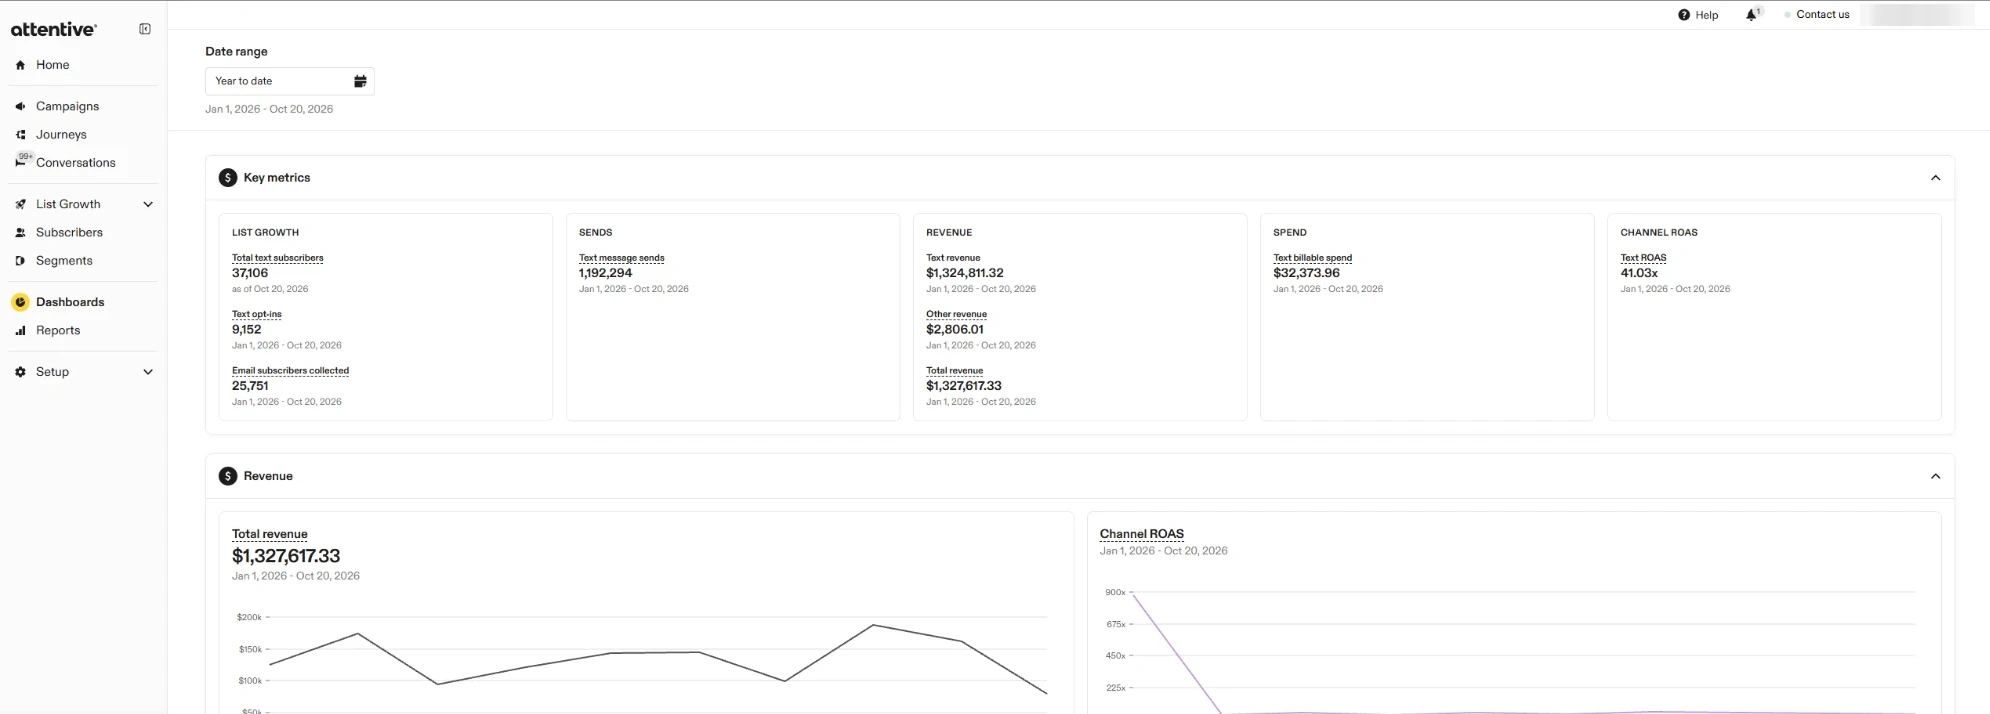
From SMS for the same jeweler, 2022 to 2025, on $187K of sends.
It overlaps with Meta and email, so it's never added to them.Source: Attentive dashboards.
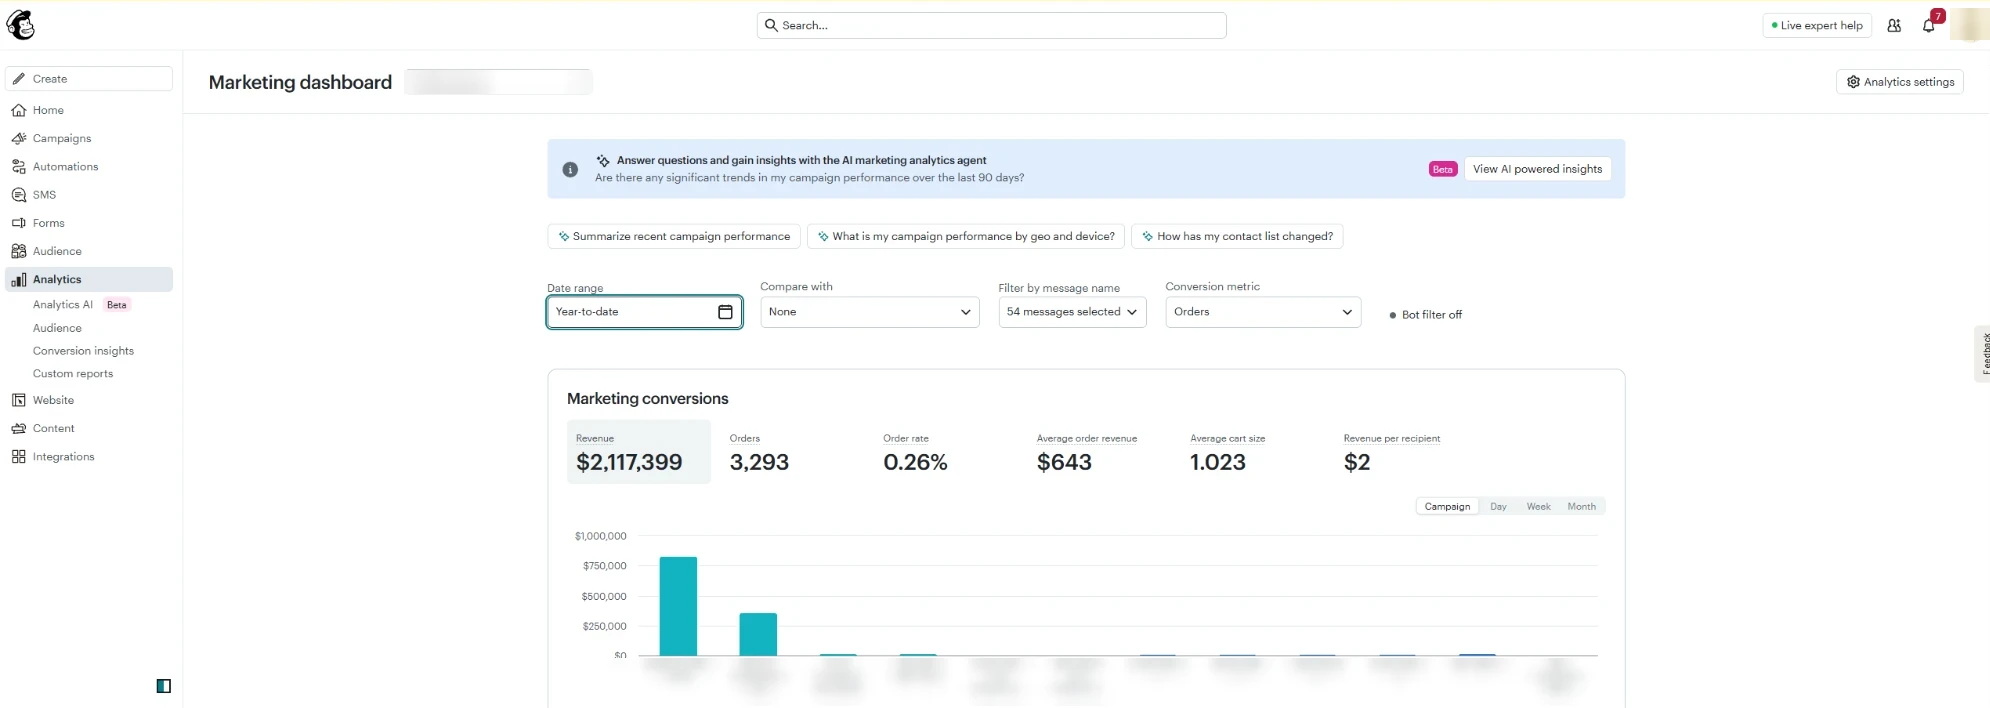
From email in the last 12 months.
Two automated flows earn most of it: welcome and abandoned cart.Source: Mailchimp marketing conversions.
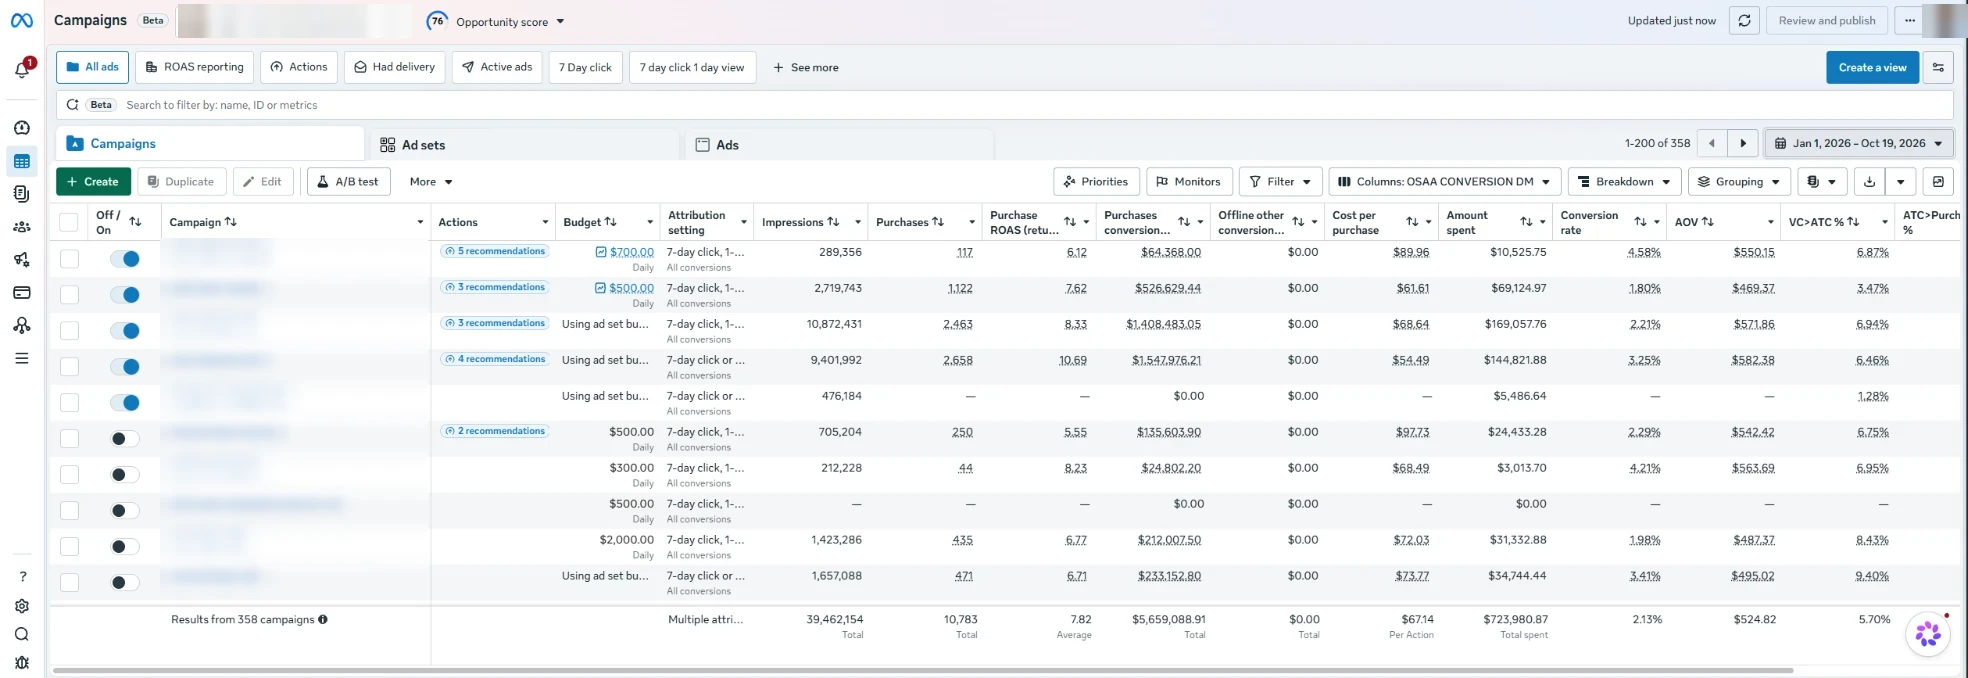
Meta-reported purchases, Korean skincare retailer, Jan 1 to Oct 18, this year against last.
At 6.06 ROAS against a breakeven of 3.5.Source: Meta Ads Manager, account totals.
Some of those customers would have bought anyway.
Meta counts a click in the last 7 days or a view in the last day. That's true of every agency's numbers; most just don't say it. So I check Meta against the store's own sales and GA4, track a promo code per channel, and decide on your breakeven, not on the prettiest number in the dashboard.
$34.46M in Meta sales, one client.
A US pearl jewelry brand, one of the largest online pearl sellers in the US: $34.46M on $5.77M of spend, 5.97 ROAS blended. I came in at Christmas 2019 with a Messenger campaign, took over all paid social in 2020, built SMS from 2022 and took over email in 2024.
| Year | Ad spend | Meta sales | ROAS |
|---|---|---|---|
| 2019Before I took over | - | $361,593 | - |
| 2020 | $332,394 | $2,803,044 | 8.43 |
| 2021 | $777,528 | $3,695,285 | 4.75 |
| 2022 | $826,003 | $3,547,886 | 4.30 |
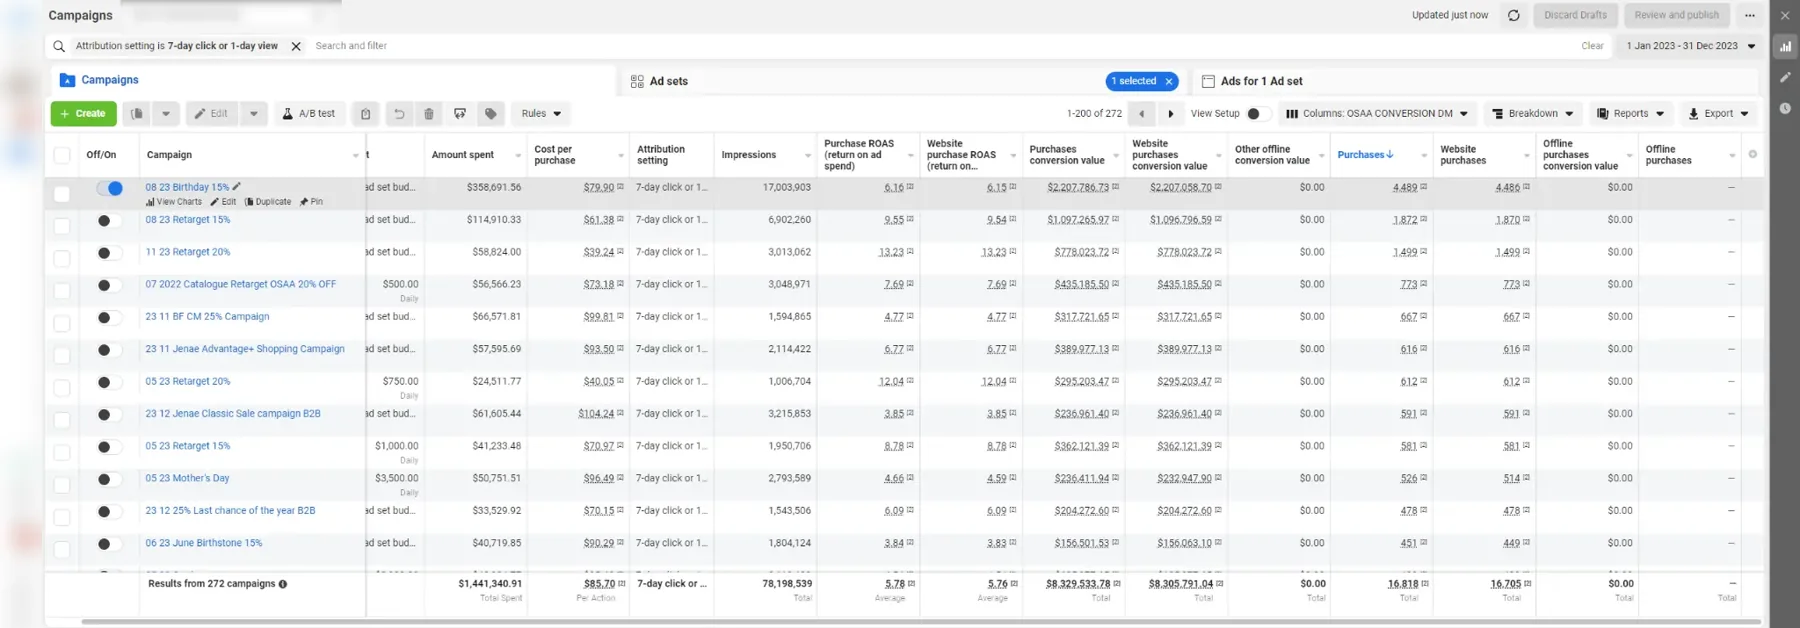
| 2023 | $1,441,341 | $8,329,533 | 5.78 |
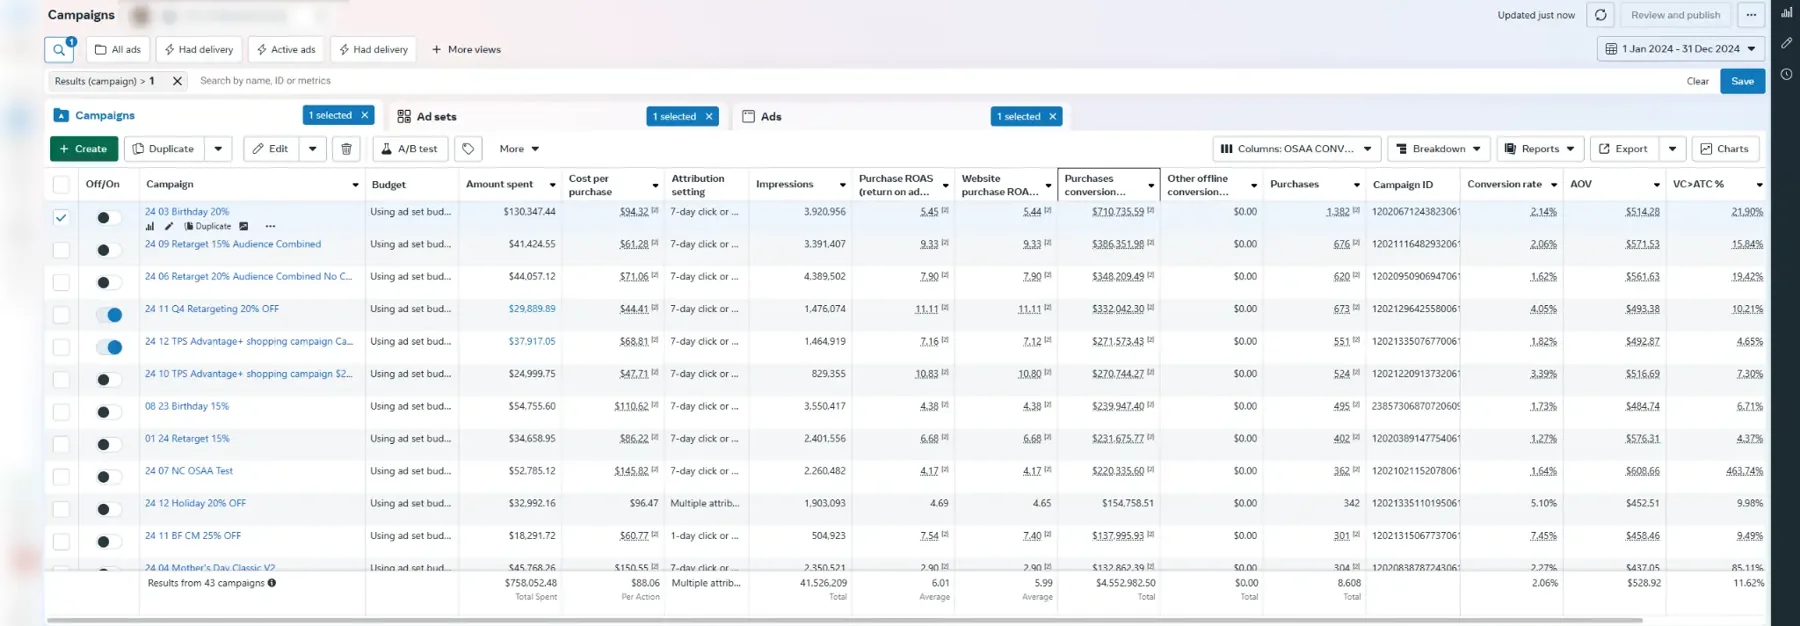
| 2024 | $758,052 | $4,552,982 | 6.01 |
| 2025 | $910,281 | $5,868,552 | 6.45 |
| 2026Jan 1 to Oct 19, 2026 | $723,981 | $5,659,089 | 7.82 |
| 2020 to 2026 | $5,769,580 | $34,456,371 | 5.97 |
[1] Client P&L sheet, 2019 to 2025. Meta Ads Manager, account totals, Jan 1 to Oct 19, 2026. Blended ROAS is total sales divided by total spend, never an average of yearly ratios.
What changed, and when
- Dec 2019
A Messenger campaign nobody in ecommerce was running at that scale. $5,355 in ads, $64,427 in sales, 254 purchases.
- 2020
Took over all paid social. $362K to $2.80M in a year, +675%, at 8.43 ROAS.
- 2021 to 2022
iOS 14 broke tracking for every advertiser. Spend more than doubled, ROAS fell to 4.30, and revenue held while the platform relearned. The low point, shown because it happened.
- 2023
The record year: $8.33M, 23 times the 2019 business.
- 2024 to 2026
ROAS up every year: 6.01, 6.45, and 7.82 so far in 2026.
Published by ManyChat, not by me. The Christmas 2019 campaign is a public case study on ManyChat's own blog. It's the one number on this page you can check without asking me.
Read it$12.15M from SMS. $3.05M from email.
2022 was the harvest year for SMS: a mature list worked for the first time. Since then it has held at $2.7M to $2.9M a year. The falling multiple is more spend against the same list, not a weaker channel.
| SMS | Send cost | Revenue | Per $1 sent |
|---|---|---|---|
| 2022 | $19,139 | $3,790,229 | 198x |
| 2023 | $43,861 | $2,795,585 | 64x |
| 2024 | $76,902 | $2,858,334 | 37x |
| 2025 | $47,131 | $2,710,676 | 58x |
| 2026to Oct 20 | $32,374 | $1,324,811 | 41x |
| 2022 to 2025 | $187,033 | $12,154,824 | 65x |
[2] Attentive dashboards, 2022 to 2025, and Jan 1 to Oct 20, 2026. List of 37,106 text subscribers. Revenue is what Attentive attributes to texts, and it overlaps with Meta and email. Read the multiple as a ceiling, not as profit: it says texting this list is cheap, not that every dollar came from it.
| Orders | Average order | Revenue | |
|---|---|---|---|
| Last 12 monthsOct 19, 2025 to Oct 19, 2026 | 4,837 | $631 | $3,051,891 |
| 2026 so farJan 1 to Oct 21, 2026 | 3,293 | $643 | $2,117,399 |
[3] Mailchimp marketing conversions and billing ($12,880 platform cost over the 12 months). Mailchimp's attribution overlaps with Meta and SMS, so it is never added to them. Two automated flows earn most of it: welcome and abandoned cart. I started by deleting 40,000 people who had stopped opening.
Client two: 1,347 to 13,161 purchases.
Korean skincare in Romania. Same months, this year against last, at 6.06 ROAS against a breakeven of 3.5. A retailer with more than 1,000 products, run on small budgets before me. Spend went up about fifteen times; store revenue in GA4, which counts every channel, was up 33% in the first half of the year.
| Jan 1 to Oct 18 | Purchases | Meta ROAS | Breakeven |
|---|---|---|---|
| 2025, before me | 1,347 | 8.85 | 3.50 |
| 2026 | 13,161 | 6.06 | 3.50 |
Meta Ads Manager, account totals, Jan 1 to Oct 18, 2026, 2026 against 2025. GA4, Jan 1 to Jun 16, 2026 against 2025.
Why two clients, when I've run more
Over the years I've run 35+ accounts: jewelry, skincare, fashion, restaurants, gyms, dental, wellness and events. Most aren't on this page, because I only publish numbers I can put a source under and a client lets me show. These two I can.
Same scrutiny for your account?
Apply with your real numbers. I'll read them the way I read these: where each one comes from, then what it proves. If I can help, you get a free 30-minute call. If I can't, I'll say so.
Tell me why you wouldn't hire me. Then let me convince you.